
Series: Kubernetes at home
- Kubernetes at home - Part 1: The hardware - January 02, 2021
- Kubernetes at home - Part 2: The install - January 05, 2021
- Kubernetes at home - Part 3: HAProxy Ingress - January 05, 2021
- Kubernetes at home - Part 4: DNS and a certificate with HAProxy Ingress - January 07, 2021
- Kubernetes at home - Part 5: Keycloak for authentication - January 16, 2021
- Kubernetes at home - Part 6: Keycloak authentication and Azure Active Directory - January 17, 2021
Kubernetes at home - Part 7: Grafana, Prometheus, and the beginnings of monitoring - January 26, 2021
- Kubernetes at home - Part 8: MinIO initialization - March 01, 2021
- Kubernetes at home - Part 9: Minecraft World0 - April 24, 2021
- Kubernetes at home - Part 10: Wiping the drives - May 09, 2021
- Kubernetes at home - Part 11: Trying Harvester and Rancher on the bare metal server - May 29, 2021
- Kubernetes at home - Part 12: Proxmox at home - December 23, 2021
Kubernetes at home - Part 7: Grafana, Prometheus, and the beginnings of monitoring
I haven’t yet bothered to find out resource utilization of my single-node Kubernetes cluster. I should fix that.
Kube-prometheus-stack
Prometheus, Grafana and friends is my monitoring stack of choice here. I’ve used both before in different scenarios, and so I went in to setting up all this quite confidently. My confidence was a foolish one for the number of common ways to install Prometheus, Grafana and all the associated components is absurd.
In the end, I have made a choice, got it working well enough, and I will revisit details as problems arise.
I chose the kube-prometheus-stack to run with.
This repository collects Kubernetes manifests, Grafana dashboards, and Prometheus rules combined with documentation and scripts to provide easy to operate end-to-end Kubernetes cluster monitoring with Prometheus using the Prometheus Operator.
Namespace and persistence
To get some stuff out of the way, I’m going to go ahead and create the namespace for installation, add the helm repo, as well as create some persistence volumes for storage. I’ve labeled the Persistent Volumes with a “purpose” so that I can match on that for selectors.
daniel@bequiet:~/development/k8s-home/prometheus$ helm repo add prometheus-community https://prometheus-community.github.io/helm-charts
"prometheus-community" has been added to your repositories

daniel@bequiet:~/development/k8s-home/prometheus$ kubectl create namespace monitoring
namespace/monitoring created

daniel@bequiet:~/development/k8s-home/prometheus$ kubectl apply -f persistence.yaml
persistentvolume/prometheus-pv-volume created
persistentvolume/grafana-pv-volume created
persistence.yaml
apiVersion: v1
kind: PersistentVolume
metadata:
  name: prometheus-pv-volume
  namespace: monitoring
  labels:
    type: local
    purpose: prometheus
spec:
  storageClassName: manual
  capacity:
    storage: 50Gi
  accessModes:
    - ReadWriteOnce
  hostPath:
    path: "/media/working/prometheus-volume/prometheus"
---
apiVersion: v1
kind: PersistentVolume
metadata:
  name: grafana-pv-volume
  namespace: monitoring
  labels:
    type: local
    purpose: grafana
spec:
  storageClassName: manual
  capacity:
    storage: 10Gi
  accessModes:
    - ReadWriteOnce
  hostPath:
    path: "/media/working/grafana-volume/grafana"
Overriding default values
Hundreds of lines show up when using the helm command to show values “helm show values prometheus-community/kube-prometheus-stack”. To narrow it down to start with, I focused on four things:
- Persist prometheus
- Persist grafana
- Adding ingress to grafana
- Allow grafana to use keycloak for sign in.
values-grafana.yaml
## Using default values from https://github.com/grafana/helm-charts/blob/main/charts/grafana/values.yaml
##
grafana:
  adminPassword: IamanadminpasswordButNotreally
  persistence:
    type: pvc
    enabled: true
    storageClassName: manual
    accessModes:
      - ReadWriteOnce
    size: 10Gi
    finalizers:
      - kubernetes.io/pvc-protection
    selectorLabels:
      type: local
      purpose: grafana
  ingress:
    enabled: true
    annotations:
      cert-manager.io/cluster-issuer: yourdomaindev-clusterissuer
      kubernetes.io/ingress.class: haproxy
      haproxy.org/forwarded-for: "enabled"
    hosts:
      - grafana.yourdomain.dev
    tls:
      - secretName: grafana-yourdomaindev-tls
        hosts:
          - grafana.yourdomain.dev
  grafana.ini:
    server:
      root_url: https://grafana.yourdomain.dev
    auth.generic_oauth:
      enabled: true
      name: "Login Keycloak"
      client_id: "grafana.yourdomain.dev"
      client_secret: "<keep-it-secret-keep-it-safe>"
      auth_url: "https://key.yourdomain.dev/auth/realms/development/protocol/openid-connect/auth"
      token_url: "https://key.yourdomain.dev/auth/realms/development/protocol/openid-connect/token"
      api_url: "https://key.yourdomain.dev/auth/realms/development/protocol/openid-connect/userinfo"
      allow_sign_up: true
      role_attribute_path: "contains(roles[*], 'admin') && 'Admin' || contains(roles[*], 'editor') && 'Editor' || 'Viewer'"
      email_attribute_name: email
      scopes: "openid profile email"
prometheus:
  prometheusSpec:
    storageSpec:
      volumeClaimTemplate:
        spec:
          accessModes: [ "ReadWriteOnce" ]
          resources:
            requests:
              storage: 50Gi
        selector:
          matchLabels:
            type: local
            purpose: prometheus
Keycloak and Grafana
The entirety of configuring Grafana to work with Keycloak came from this step-by-step by Janik Vonrotz. All I care to show is shipping ahead to the end result of the Grafana page. I get a convenient button which will redirect me to Keycloak to sign in and then back.
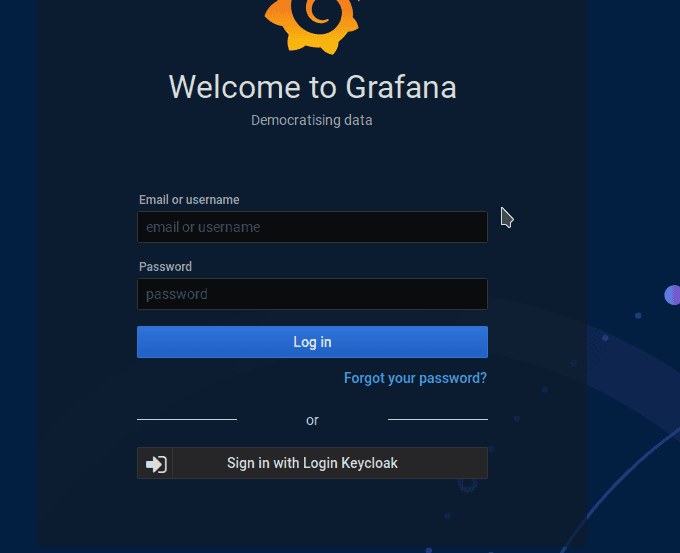
The highlights include
- Creating a new client in Keycloak
- Assigning a Grafana admin role to my user in Keycloak.
- Configuring Grafana.ini with openid info, pointing the email attribute to the right place, and allow for pulling Grafana role automatically from Keycloak assigned roles.
Install
daniel@bequiet:~/development/k8s-home/prometheus$ helm install kube-prometheus-stack prometheus-community/kube-prometheus-stack --namespace monitoring --values values.yaml
NAME: kube-prometheus-stack
LAST DEPLOYED: Tue Jan 26 03:43:44 2021
NAMESPACE: monitoring
STATUS: deployed
REVISION: 1
NOTES:
kube-prometheus-stack has been installed. Check its status by running:
  kubectl --namespace monitoring get pods -l "release=kube-prometheus-stack"

Visit https://github.com/prometheus-operator/kube-prometheus for instructions on how to create & configure Alertmanager and Prometheus instances using the Operator.
I walked away and then came back 20 minutes later and it all worked. I went to “grafana.yourdomain.dev” (but not actually at “yourdomain”, I have a specific domain myself).
daniel@bequiet:~/development/k8s-home/prometheus$ kubectl get all --namespace monitoring
NAME                                                            READY   STATUS    RESTARTS   AGE
pod/alertmanager-kube-prometheus-stack-alertmanager-0           2/2     Running   0          22m
pod/kube-prometheus-stack-grafana-77f5bd75b7-775f7              2/2     Running   0          22m
pod/kube-prometheus-stack-kube-state-metrics-5cf575d8f8-9jnhh   1/1     Running   0          22m
pod/kube-prometheus-stack-operator-79869547b5-2rpqz             1/1     Running   0          22m
pod/kube-prometheus-stack-prometheus-node-exporter-jqs5p        1/1     Running   0          22m
pod/prometheus-kube-prometheus-stack-prometheus-0               2/2     Running   1          22m

NAME                                                     TYPE        CLUSTER-IP       EXTERNAL-IP   PORT(S)                      AGE
service/alertmanager-operated                            ClusterIP   None             <none>        9093/TCP,9094/TCP,9094/UDP   22m
service/kube-prometheus-stack-alertmanager               ClusterIP   10.102.118.231   <none>        9093/TCP                     22m
service/kube-prometheus-stack-grafana                    ClusterIP   10.104.132.29    <none>        80/TCP                       22m
service/kube-prometheus-stack-kube-state-metrics         ClusterIP   10.111.155.72    <none>        8080/TCP                     22m
service/kube-prometheus-stack-operator                   ClusterIP   10.100.7.14      <none>        443/TCP                      22m
service/kube-prometheus-stack-prometheus                 ClusterIP   10.104.194.5     <none>        9090/TCP                     22m
service/kube-prometheus-stack-prometheus-node-exporter   ClusterIP   10.107.133.11    <none>        9100/TCP                     22m
service/prometheus-operated                              ClusterIP   None             <none>        9090/TCP                     22m

NAME                                                            DESIRED   CURRENT   READY   UP-TO-DATE   AVAILABLE   NODE SELECTOR   AGE
daemonset.apps/kube-prometheus-stack-prometheus-node-exporter   1         1         1       1            1           <none>          22m

NAME                                                       READY   UP-TO-DATE   AVAILABLE   AGE
deployment.apps/kube-prometheus-stack-grafana              1/1     1            1           22m
deployment.apps/kube-prometheus-stack-kube-state-metrics   1/1     1            1           22m
deployment.apps/kube-prometheus-stack-operator             1/1     1            1           22m

NAME                                                                  DESIRED   CURRENT   READY   AGE
replicaset.apps/kube-prometheus-stack-grafana-77f5bd75b7              1         1         1       22m
replicaset.apps/kube-prometheus-stack-kube-state-metrics-5cf575d8f8   1         1         1       22m
replicaset.apps/kube-prometheus-stack-operator-79869547b5             1         1         1       22m

NAME                                                               READY   AGE
statefulset.apps/alertmanager-kube-prometheus-stack-alertmanager   1/1     22m
statefulset.apps/prometheus-kube-prometheus-stack-prometheus       1/1     22m
Exploring dashboards
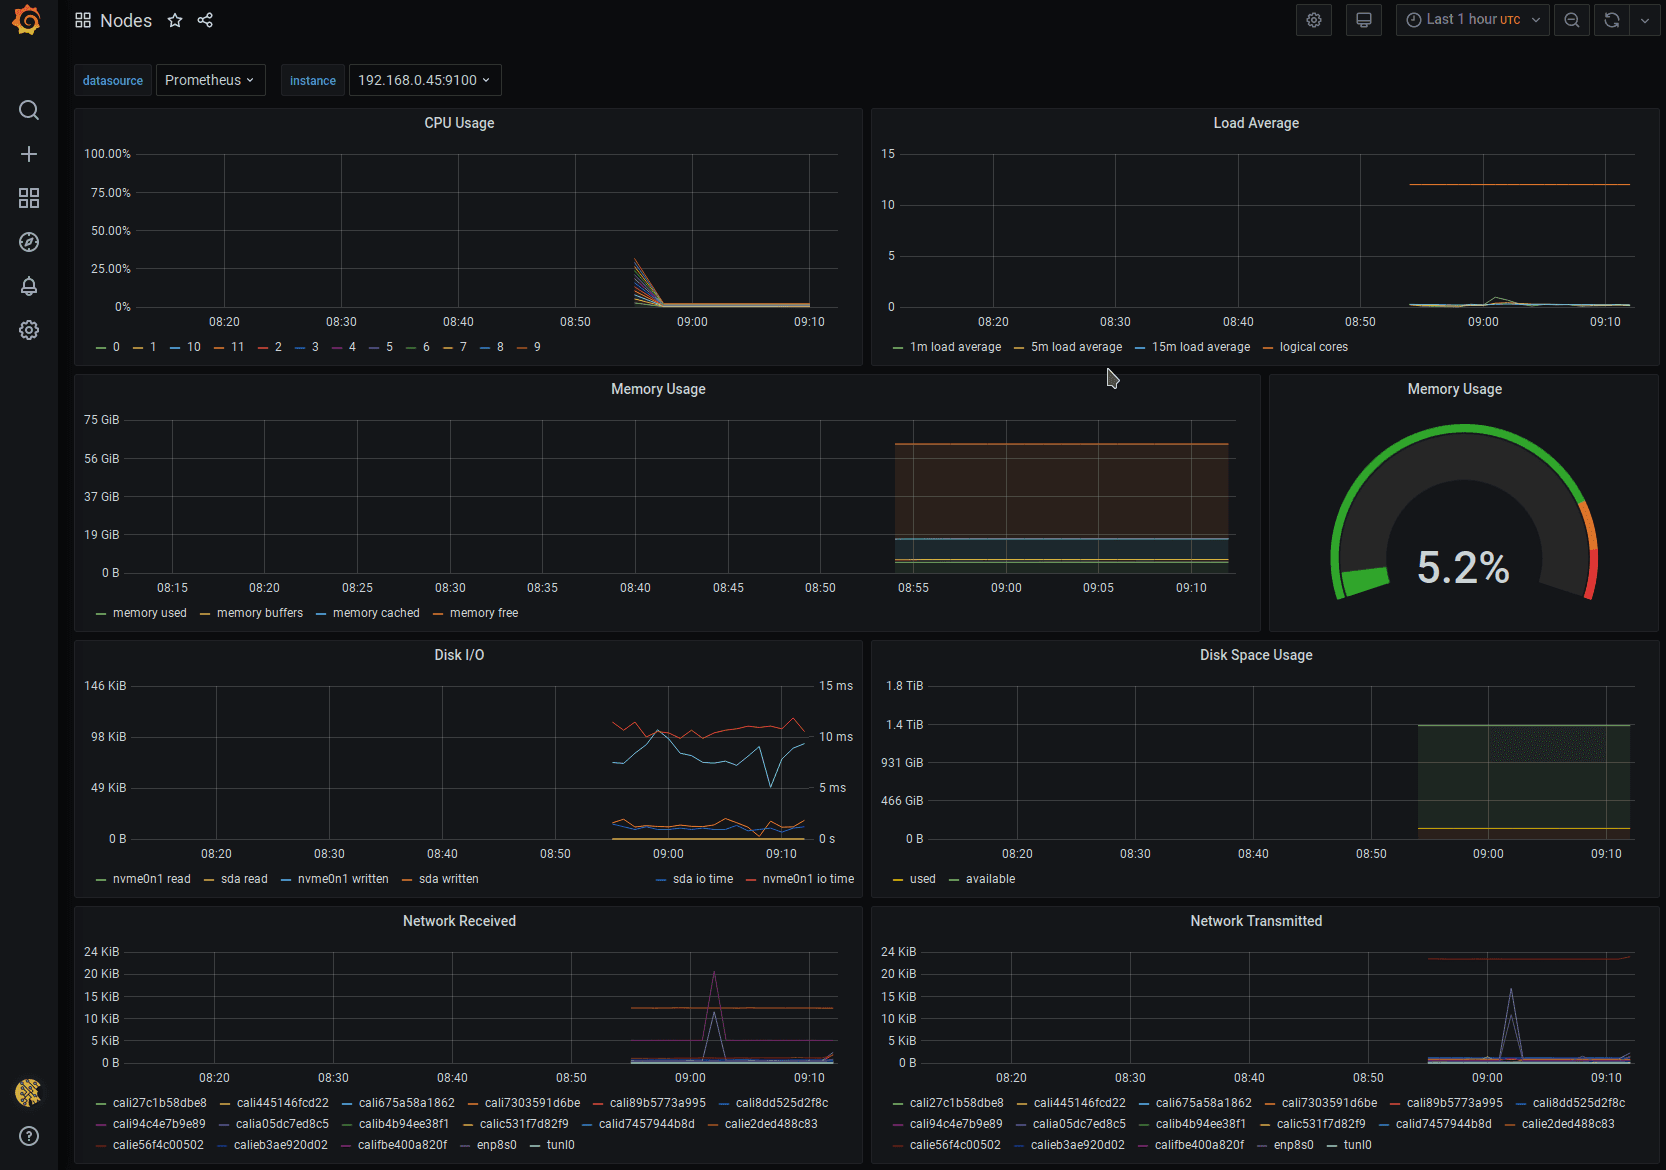
A number of dashboards are includes automatically which is very neat.
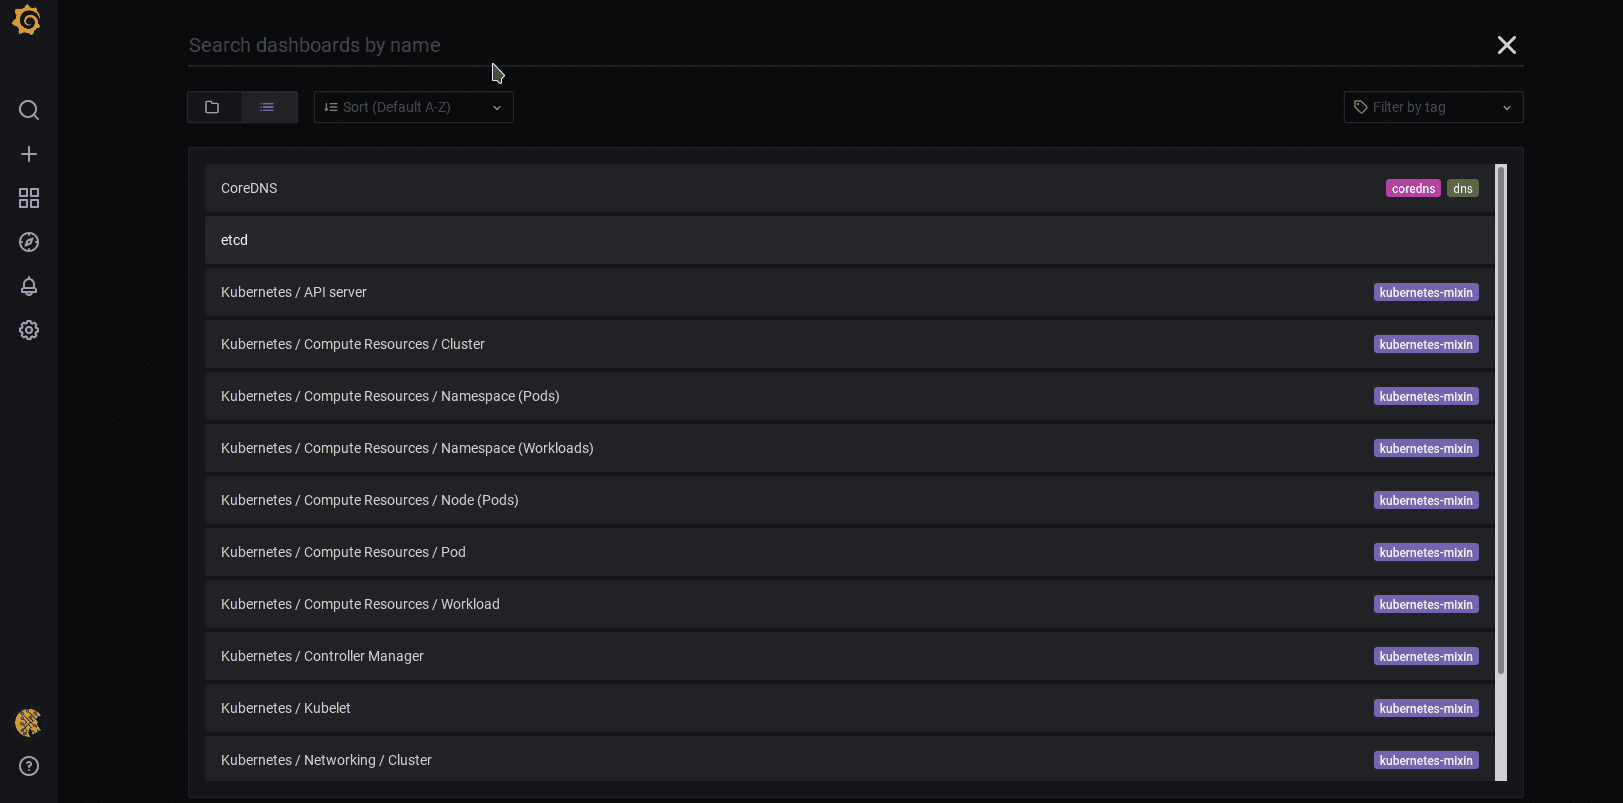
Since my immediate goal today is resource utilization, I can pick out the dashboard purely titled “Nodes”. Offhand, I suppose resource utilization looks good right now. I don’t have a baseline of comparison, so all I can say is that percentages don’t look heavy at all.
Summary
I did the bare minimum to get Grafana, Prometheus, and associated monitoring components installed onto my single-node Kubernetes cluster. My philosophy about why I did that will be in a coming blog post later.
Series: Kubernetes at home
- Kubernetes at home - Part 1: The hardware - January 02, 2021
- Kubernetes at home - Part 2: The install - January 05, 2021
- Kubernetes at home - Part 3: HAProxy Ingress - January 05, 2021
- Kubernetes at home - Part 4: DNS and a certificate with HAProxy Ingress - January 07, 2021
- Kubernetes at home - Part 5: Keycloak for authentication - January 16, 2021
- Kubernetes at home - Part 6: Keycloak authentication and Azure Active Directory - January 17, 2021
Kubernetes at home - Part 7: Grafana, Prometheus, and the beginnings of monitoring - January 26, 2021
- Kubernetes at home - Part 8: MinIO initialization - March 01, 2021
- Kubernetes at home - Part 9: Minecraft World0 - April 24, 2021
- Kubernetes at home - Part 10: Wiping the drives - May 09, 2021
- Kubernetes at home - Part 11: Trying Harvester and Rancher on the bare metal server - May 29, 2021
- Kubernetes at home - Part 12: Proxmox at home - December 23, 2021