
OpenTracing and C#: part 2
OpenTracing is a fascinating standard for “Vendor-neutral APIs and instrumentation for distributed tracing”.
Blog post part 1 is here. And in my first blog post I showed a minimal example of adding OpenTracing to a single application. In this post I’m going to show how to truly show distributed traces.
Setup
I have two C# Web APIs in .NET Core 2.1 that I created by dotnet new webapi. They’re named “jaeger-csharp-backend-api” and “jaeger-csharp-frontend-api”. The intent being that the frontend API calls the backend API.
The frontend API is using port 5002, and the backend API is using port 5000.
Startup.cs
The Startup.cs file for both looks the same, apart from namespace differences.
using Jaeger;
using Jaeger.Samplers;
using Microsoft.AspNetCore.Builder;
using Microsoft.AspNetCore.Hosting;
using Microsoft.AspNetCore.Mvc;
using Microsoft.Extensions.Configuration;
using Microsoft.Extensions.DependencyInjection;
using OpenTracing;
using OpenTracing.Contrib.NetCore.CoreFx;
using OpenTracing.Util;
using System.Net.Http;

namespace jaeger_csharp_frontend_api
{
    public class Startup
    {
        public Startup(IConfiguration configuration)
        {
            Configuration = configuration;
        }

        public IConfiguration Configuration { get; }

        // This method gets called by the runtime. Use this method to add services to the container.
        public void ConfigureServices(IServiceCollection services)
        {
            services.AddMvc().SetCompatibilityVersion(CompatibilityVersion.Version_2_1);
            services.AddOpenTracing();
            services.AddTransient<HttpClient>();

            // Adds the Jaeger Tracer.
            services.AddSingleton<ITracer>(serviceProvider =>
            {
                string serviceName = serviceProvider.GetRequiredService<IHostingEnvironment>().ApplicationName;

                // This will log to a default localhost installation of Jaeger.
                var tracer = new Tracer.Builder(serviceName)
                    .WithSampler(new ConstSampler(true))
                    .Build();

                // Allows code that can't use DI to also access the tracer.
                GlobalTracer.Register(tracer);

                return tracer;
            });

            services.Configure<HttpHandlerDiagnosticOptions>(options =>
            {
                options.IgnorePatterns.Add(x => !x.RequestUri.IsLoopback);
            });
        }

        // This method gets called by the runtime. Use this method to configure the HTTP request pipeline.
        public void Configure(IApplicationBuilder app, IHostingEnvironment env)
        {
            if (env.IsDevelopment())
            {
                app.UseDeveloperExceptionPage();
            }

            app.UseMvc();
        }
    }
}
The code above looks almost the same as in the blog post part 1, but something crucial has been added:
            services.Configure<HttpHandlerDiagnosticOptions>(options =>
            {
                options.IgnorePatterns.Add(x => !x.RequestUri.IsLoopback);
            });
This comes from the C# OpenTracing .NET Core library and the intent is to filter what calls to C#‘s HttpClient will get HTTP Headers attached that represent trace information.
A list of delegates that define whether or not a given request should be ignored. If any delegate in the list returns true, the request will be ignored.
The information in these HTTP Headers is what allows Jaeger and other OpenTracing implementations to trace distributed calls as they happen.
Frontend API
The default ValueController for the frontend API doesn’t do much on its own, so it’s going to call the backend API and return back whatever values it can from there.
using System;
using System.Collections.Generic;
using System.Net.Http;
using System.Threading.Tasks;
using Microsoft.AspNetCore.Mvc;
using Newtonsoft.Json;
using OpenTracing;

namespace jaeger_csharp_frontend_api.Controllers
{
    [Route("api/[controller]")]
    [ApiController]
    public class ValuesController : ControllerBase
    {
        private readonly ITracer tracer;
        private readonly HttpClient httpClient;

        public ValuesController(ITracer tracer, HttpClient httpClient)
        {
            this.tracer = tracer;
            this.httpClient = httpClient;
            this.httpClient.BaseAddress = new Uri("http://localhost:5000/api/");
        }

        // GET api/values
        [HttpGet]
        public async Task<ActionResult<IEnumerable<string>>> Get()
        {
            using (IScope scope = tracer.BuildSpan("waitingForValues").StartActive(finishSpanOnDispose: true))
            {
                var response = await this.httpClient.GetStringAsync("values");
                return JsonConvert.DeserializeObject<List<string>>(response);
            }
        }
    }
}
A really interesting thing to note above, is that the HttpClient is injected into the Controller above, and it will have the filter defined in Startup.cs that determines whether to add trace headers or not. This allows Tracing to be enabled, disabled, and configured at a convenient central place.
Backend API
Nothing surprising about the backend API.
using System;
using System.Collections.Generic;
using System.Linq;
using System.Threading.Tasks;
using Microsoft.AspNetCore.Mvc;
namespace jaeger_csharp_backend_api.Controllers
{
[Route("api/[controller]")]
[ApiController]
public class ValuesController : ControllerBase
{
// GET api/values
[HttpGet]
public ActionResult<IEnumerable<string>> Get()
{
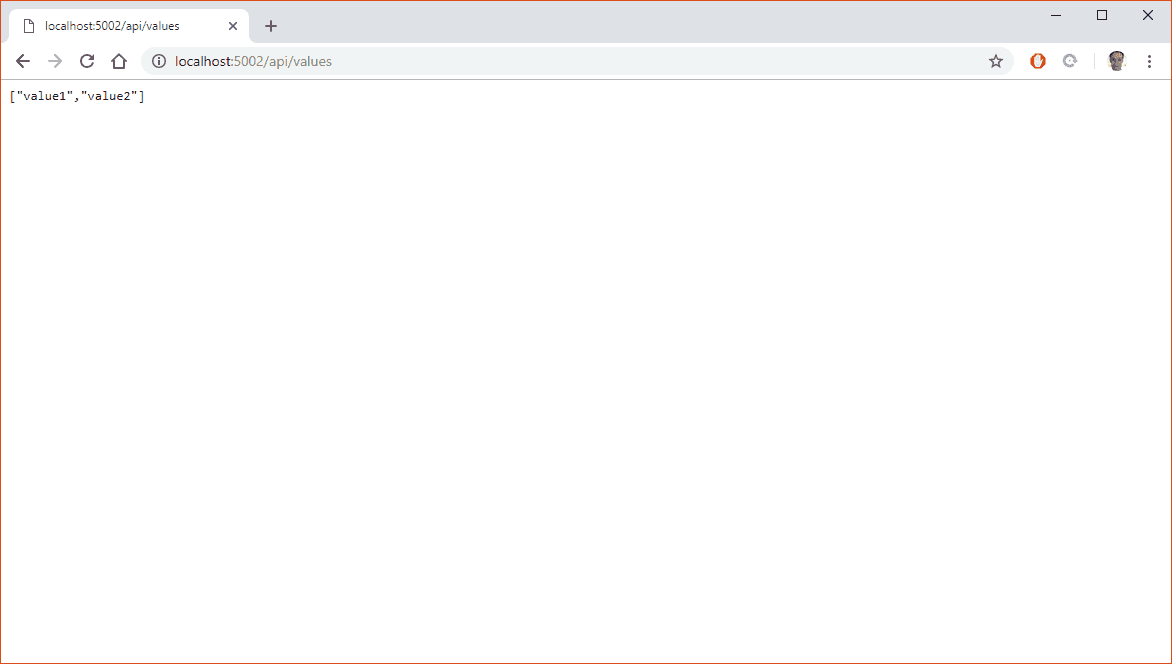
return new string[] { "value1", "value2" };
}
}
}Starting Jaeger
Before going any further, I’m going to make sure that Jaeger is started up. I’m using the default jaeger-all-in-one.exe for ease of testing locally on my machine.
Calling the Frontend API
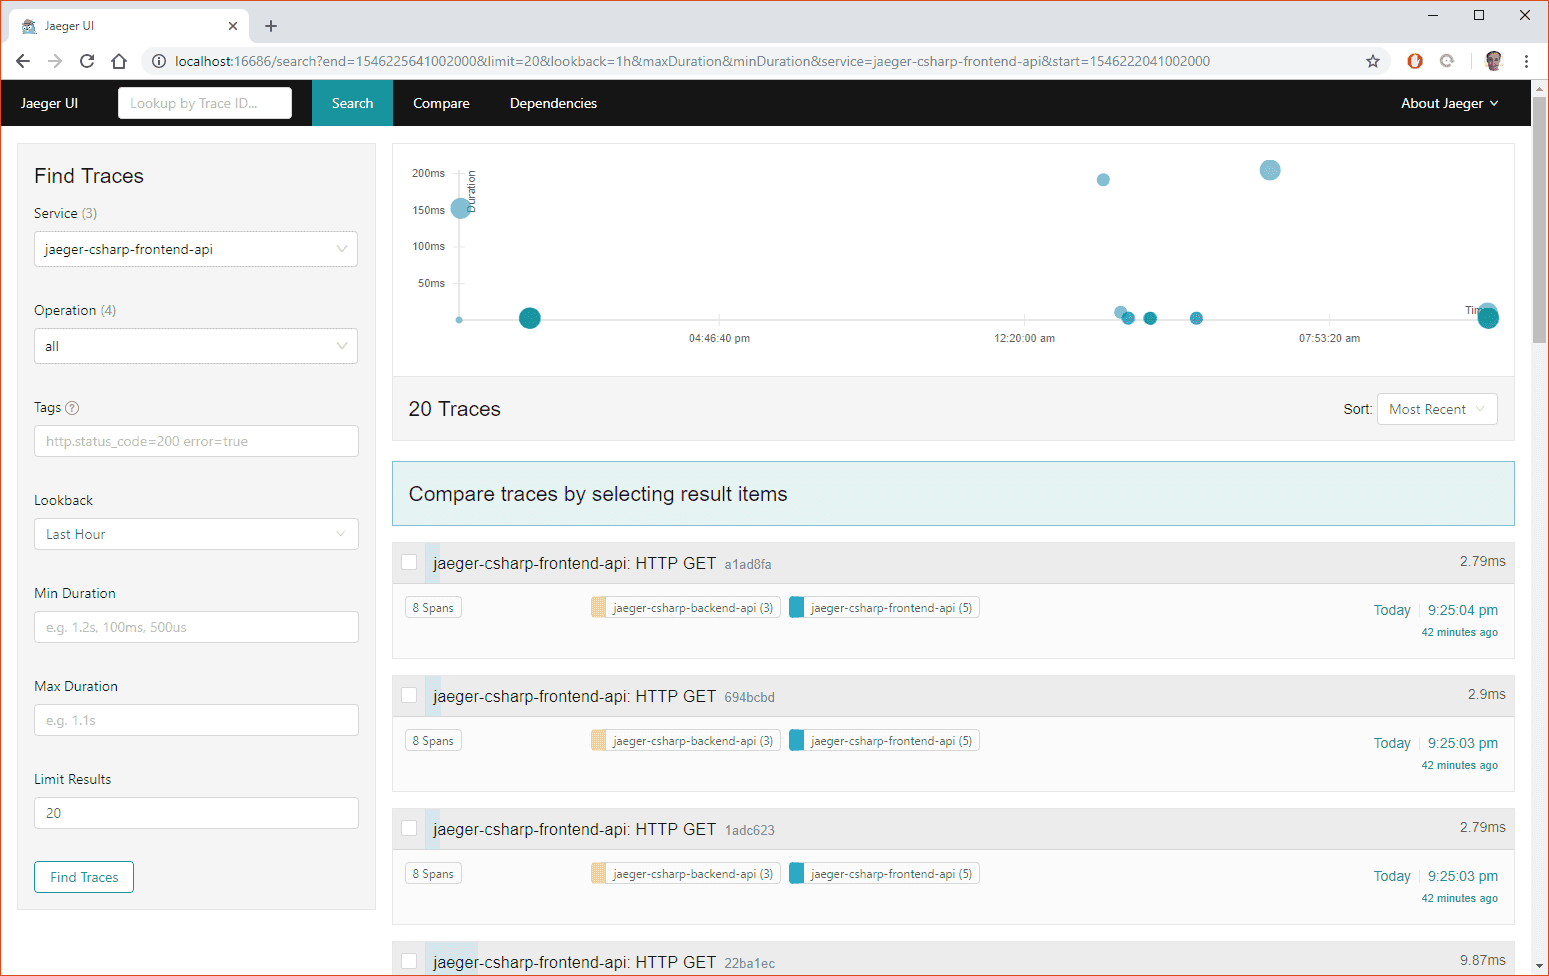
To get a good sample, I’m going to call the frontend API several times.
View Traces
Part of the Jaeger-all-in-one.exe is a convenient webpage locally at ”http://localhost:16686” to view traces. The default page that comes up is the Search panel, and I’m going to click on the dropdown and select my frontend-api.
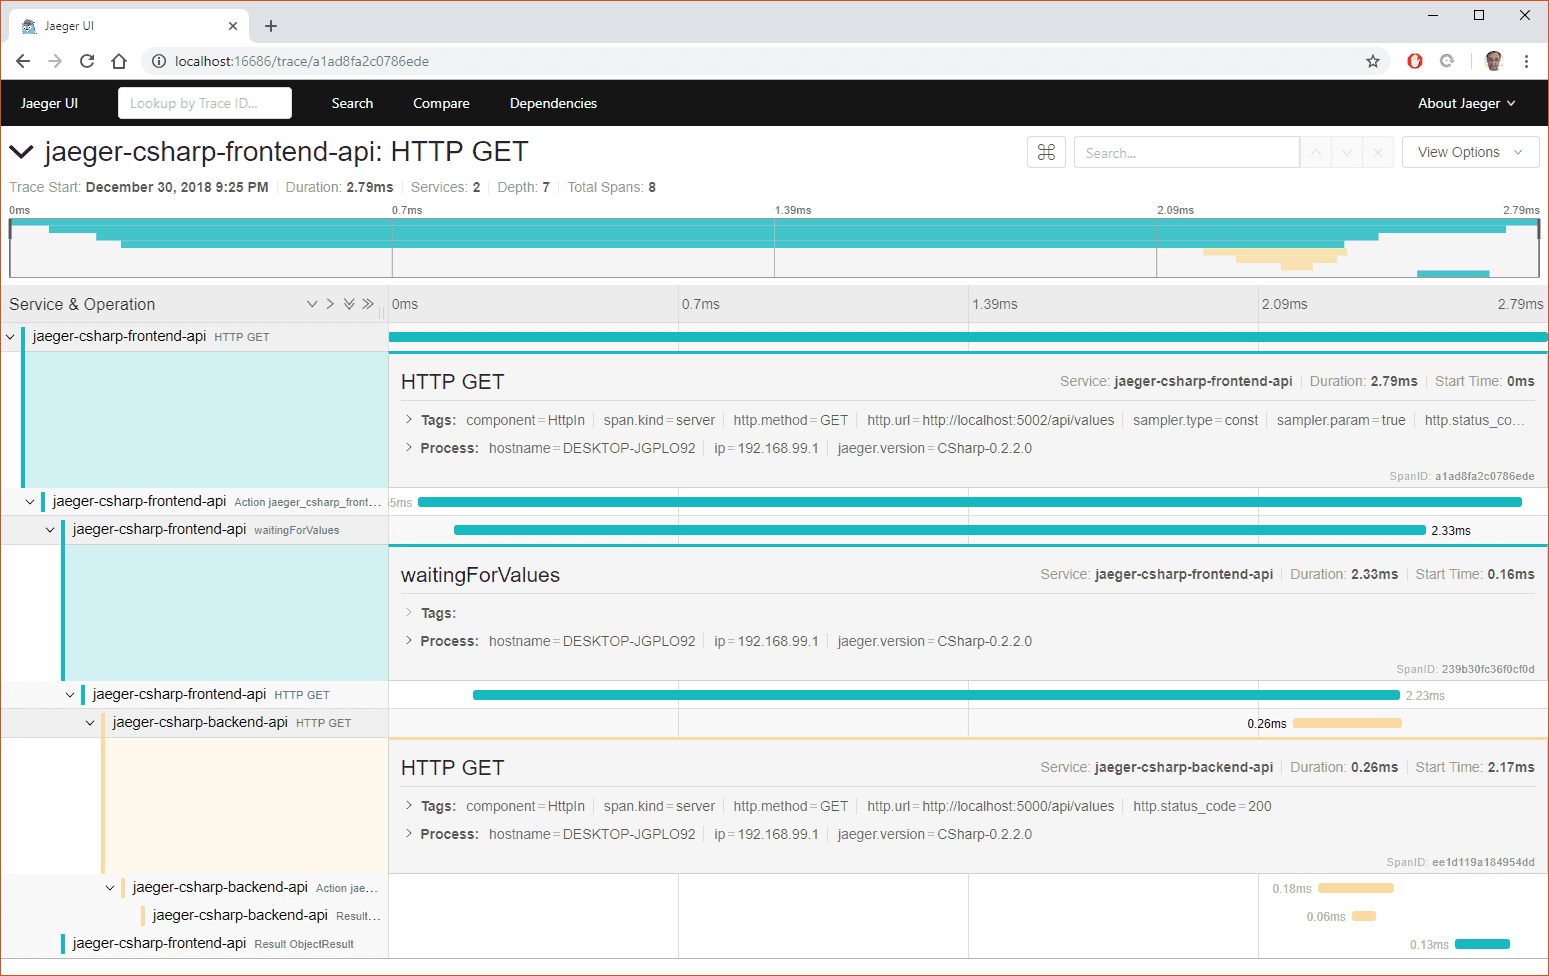
Inspect Trace
When I click on the top trace, I can inspect each step in greater detail. I can see how long each individual piece of the services took and I can now debug performance issues.
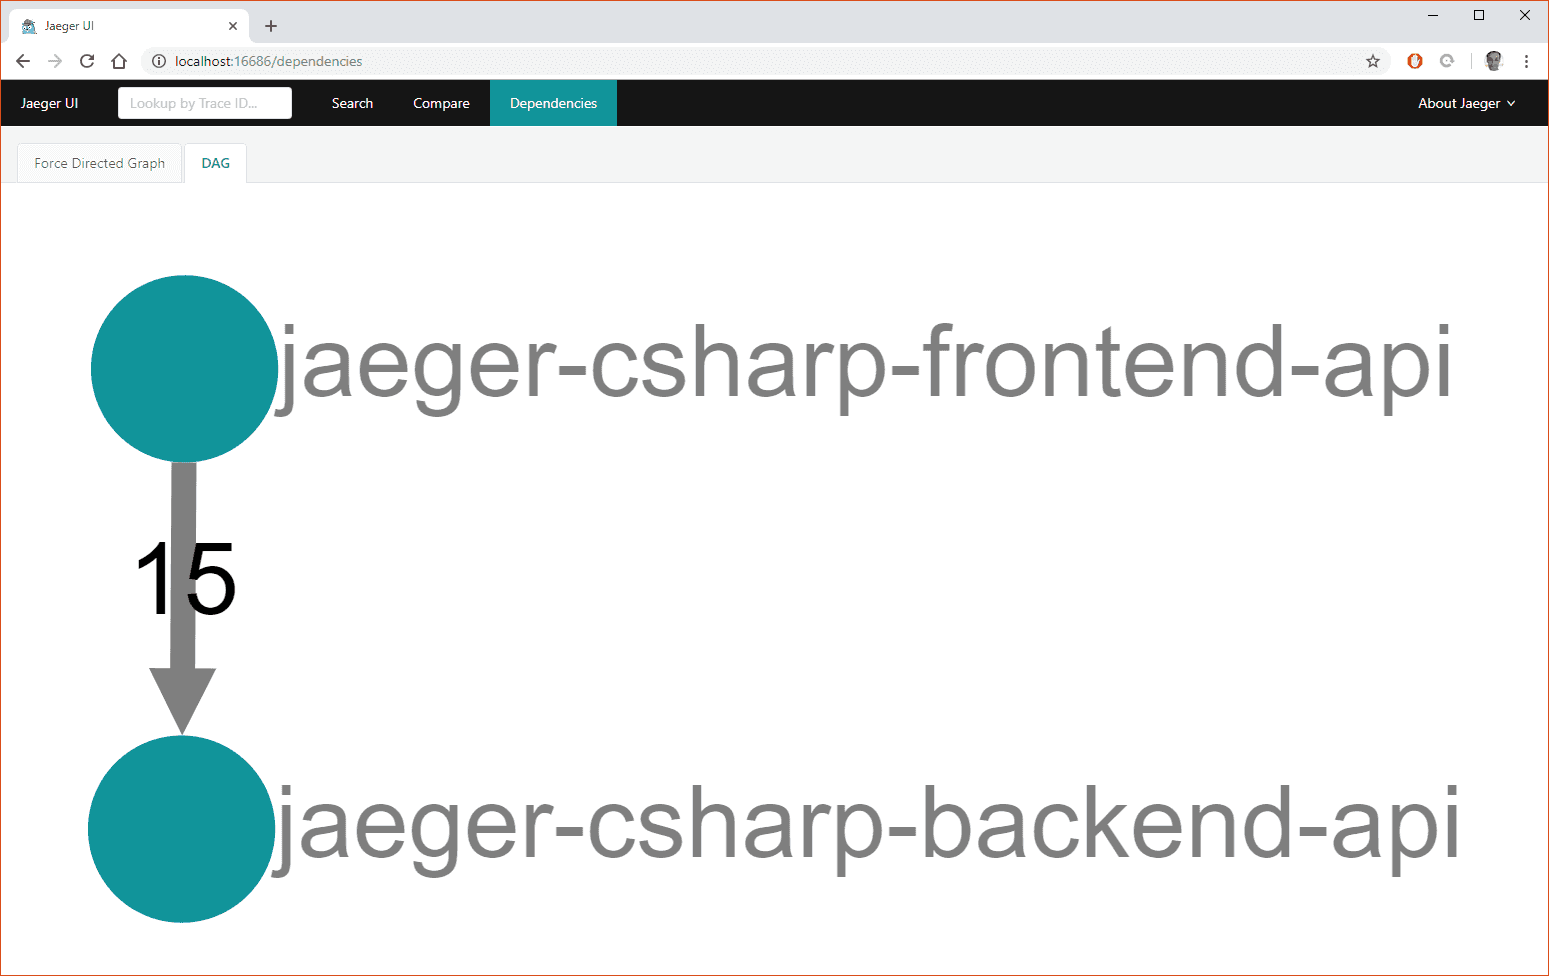
Dependencies
Further, I can now start looking at dependencies between systems with OpenTracing. Ideally, you’d already know these, but once teams diverge to work on separate systems and communication channels multiply, odds are good an unknown dependency can sneak in there.
Summary
My code is here. I’m very excited about having distributed traces to monitor and debug performance issues and find common points of failures. Quality control via monitoring to build confidence in systems is fast becoming something I want to build more rigorously into my solutions. Because of this, I’m very interested in where the W3C wants to take traces to.