
OpenTracing and C#
OpenTracing is a fascinating standard for “Vendor-neutral APIs and instrumentation for distributed tracing”. I’m doing this blog post as part of the Second Annual C# Advent Calendar!
Jaeger
OpenTracing isn’t the concrete implementation, but rather a standard. Jaeger is one such set of libraries and tools that provide an implementation with “open source, end-to-end distributed tracing”.
I happen to be running Jaeger locally with the All-in-one executable for quick testing.
C# and OpenTracing
I’ve created a new .NET Core API project and added a reference to Jaeger and to OpenTracing libraries. The .csproj file looks like this.
<Project Sdk="Microsoft.NET.Sdk.Web">
  <PropertyGroup>
    <TargetFramework>netcoreapp2.1</TargetFramework>
  </PropertyGroup>

  <ItemGroup>
    <Folder Include="wwwroot\" />
  </ItemGroup>

  <ItemGroup>
    <PackageReference Include="Jaeger" Version="0.2.2" />
    <PackageReference Include="Microsoft.AspNetCore.App" />
    <PackageReference Include="Microsoft.AspNetCore.Razor.Design" Version="2.1.2" PrivateAssets="All" />
    <PackageReference Include="OpenTracing" Version="0.12.0" />
    <PackageReference Include="OpenTracing.Contrib.NetCore" Version="0.5.0" />
  </ItemGroup>
</Project>
I’m then replacing the Startup.cs file with this setup code which comes straight from the Jaeger Example code.
using System;
using System.Collections.Generic;
using System.Linq;
using System.Threading.Tasks;
using Microsoft.AspNetCore.Builder;
using Microsoft.AspNetCore.Hosting;
using Microsoft.AspNetCore.HttpsPolicy;
using Microsoft.AspNetCore.Mvc;
using Microsoft.Extensions.Configuration;
using Microsoft.Extensions.DependencyInjection;
using Microsoft.Extensions.Logging;
using Microsoft.Extensions.Options;
using OpenTracing;
using OpenTracing.Util;
using Jaeger.Samplers;
using Jaeger;

namespace jaeger_csharp_example
{
    public class Startup
    {
        public Startup(IConfiguration configuration)
        {
            Configuration = configuration;
        }

        public IConfiguration Configuration { get; }

        // This method gets called by the runtime. Use this method to add services to the container.
        public void ConfigureServices(IServiceCollection services)
        {
            services.AddMvc().SetCompatibilityVersion(CompatibilityVersion.Version_2_1);
            services.AddOpenTracing();

            // Adds the Jaeger Tracer.
            services.AddSingleton<ITracer>(serviceProvider =>
            {
                string serviceName = serviceProvider.GetRequiredService<IHostingEnvironment>().ApplicationName;

                // This will log to a default localhost installation of Jaeger.
                var tracer = new Tracer.Builder(serviceName)
                    .WithSampler(new ConstSampler(true))
                    .Build();

                // Allows code that can't use DI to also access the tracer.
                GlobalTracer.Register(tracer);

                return tracer;
            });
        }

        // This method gets called by the runtime. Use this method to configure the HTTP request pipeline.
        public void Configure(IApplicationBuilder app, IHostingEnvironment env)
        {
            if (env.IsDevelopment())
            {
                app.UseDeveloperExceptionPage();
            }
            app.UseMvc();
        }
    }
}
The most important thing to note, is that OpenTracing will now automatically track requests to the Web API and create Spans automatically. The term Span comes from the OpenTracing Semantic Specification and is part of the larger definition:
Traces in OpenTracing are defined implicitly by their Spans. In particular, a Trace can be thought of as a directed acyclic graph (DAG) of Spans, where the edges between Spans are called References.
Custom Span
Before I show the results, let’s add a custom Span in the default Values controller.
using System;
using System.Collections.Generic;
using System.Linq;
using System.Threading.Tasks;
using Microsoft.AspNetCore.Mvc;
using OpenTracing;
namespace jaeger_csharp_example.Controllers
{
[Route("api/[controller]")]
[ApiController]
public class ValuesController : ControllerBase
{
private readonly ITracer tracer;
public ValuesController(ITracer tracer)
{
this.tracer = tracer;
}
// GET api/values
[HttpGet]
public async Task<ActionResult<IEnumerable<string>>> Get()
{
using (IScope scope = tracer.BuildSpan("waitingForValues").StartActive(finishSpanOnDispose: true))
{
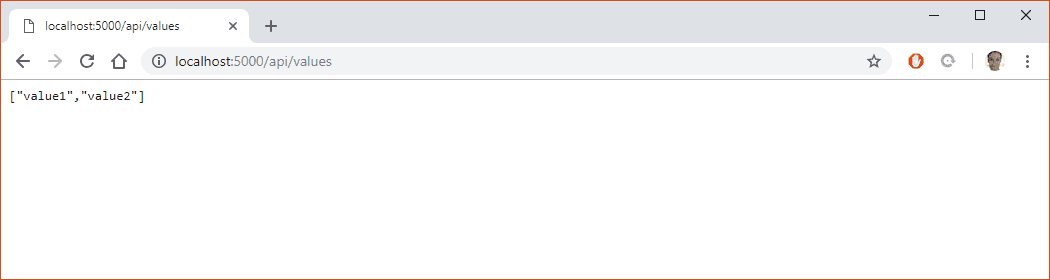
await Task.Delay(1000);
return new string[] { "value1", "value2" };
}
}
}
}Now let’s call the Values Controller a few times
Jaeger C# Trace
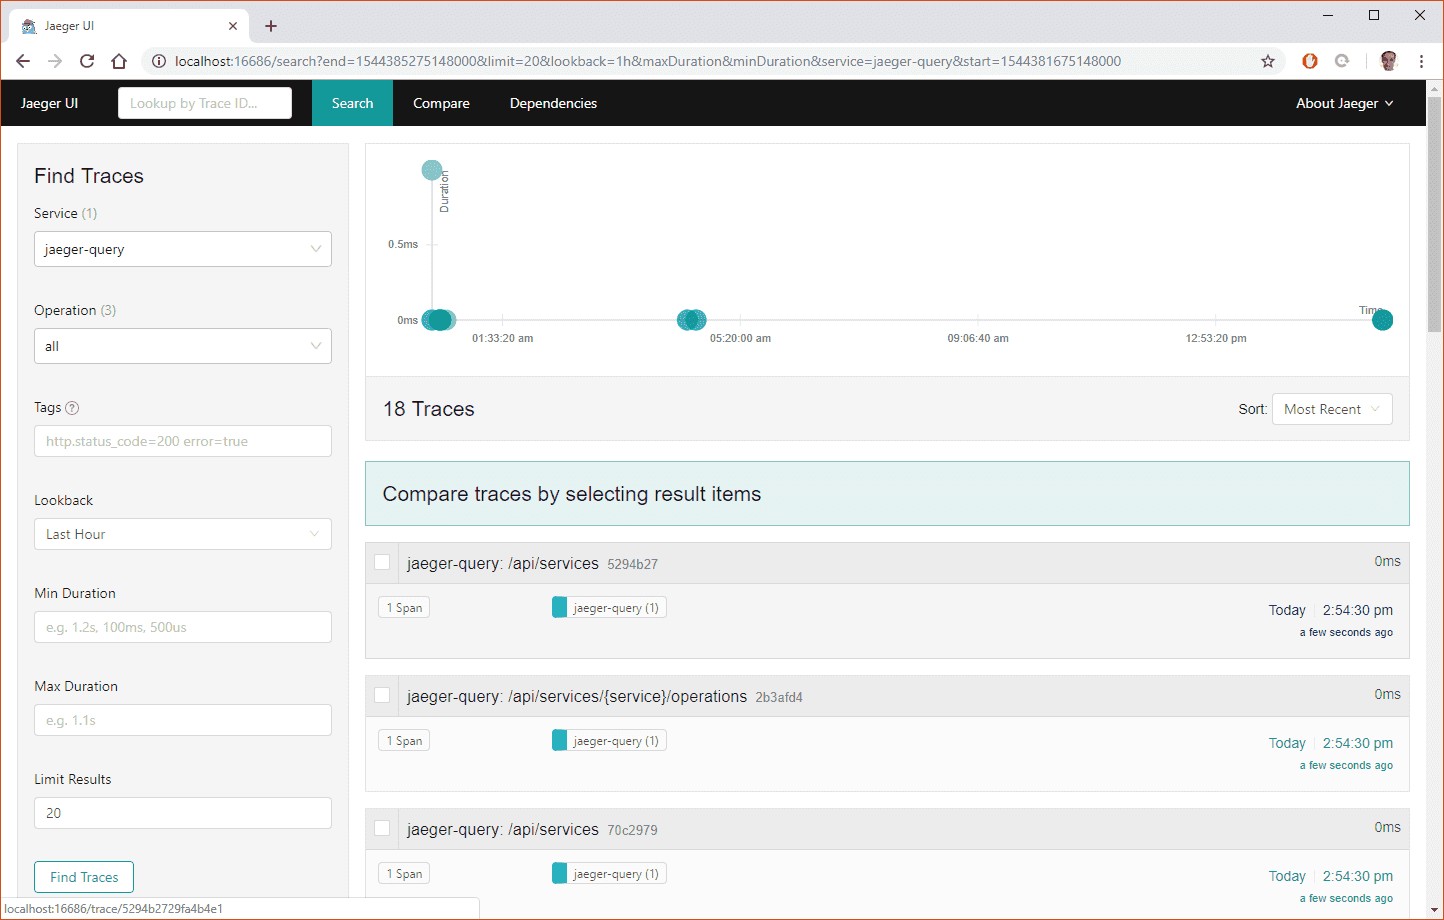
When I look in Jaeger, I can see the recent Traces made against my API.
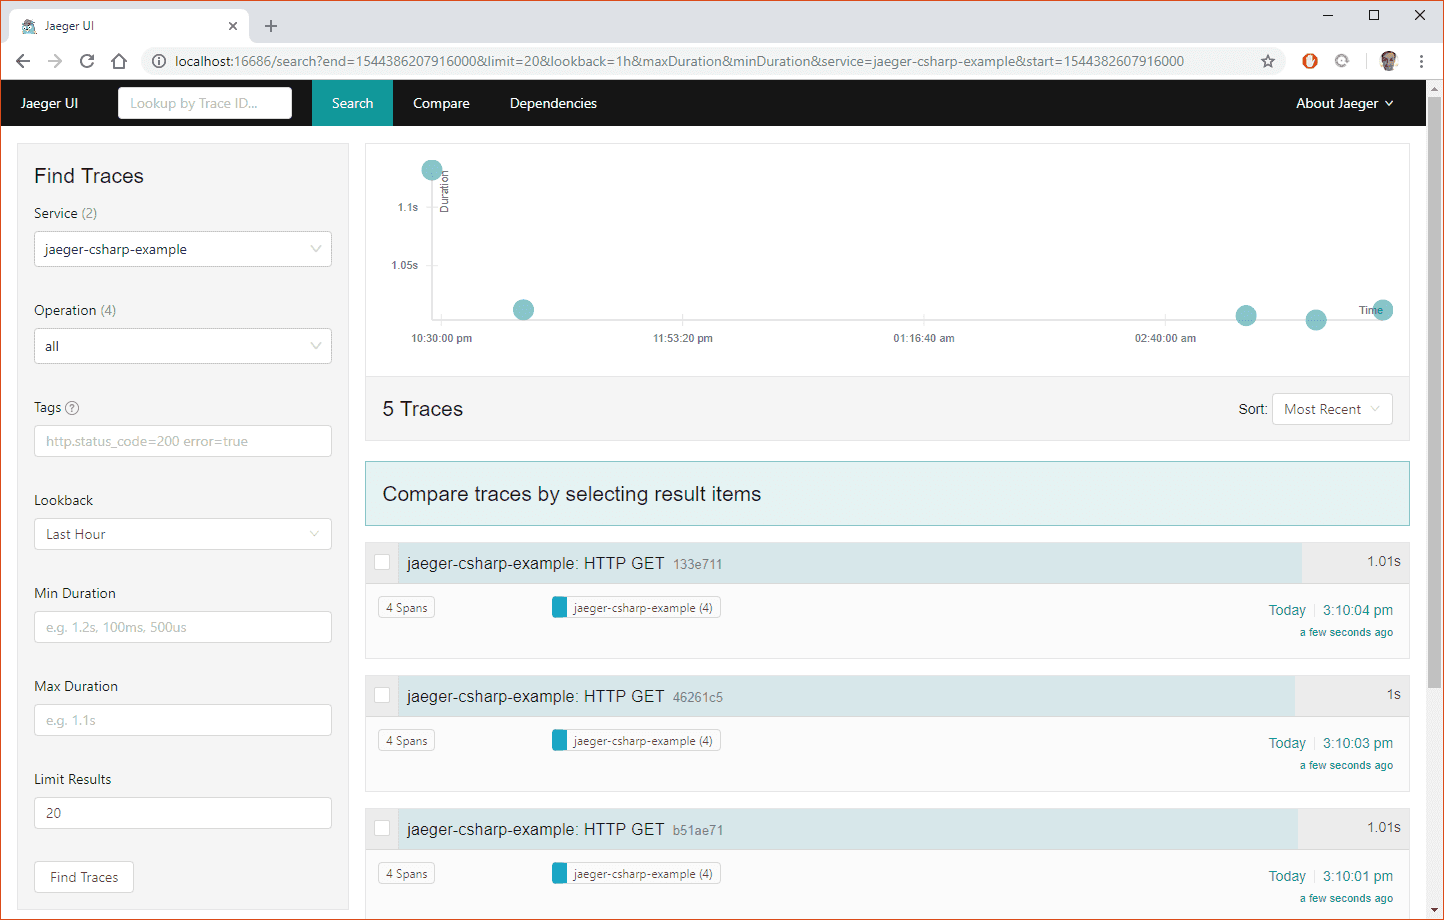
I can then sample a few Traces and really drill down into them.
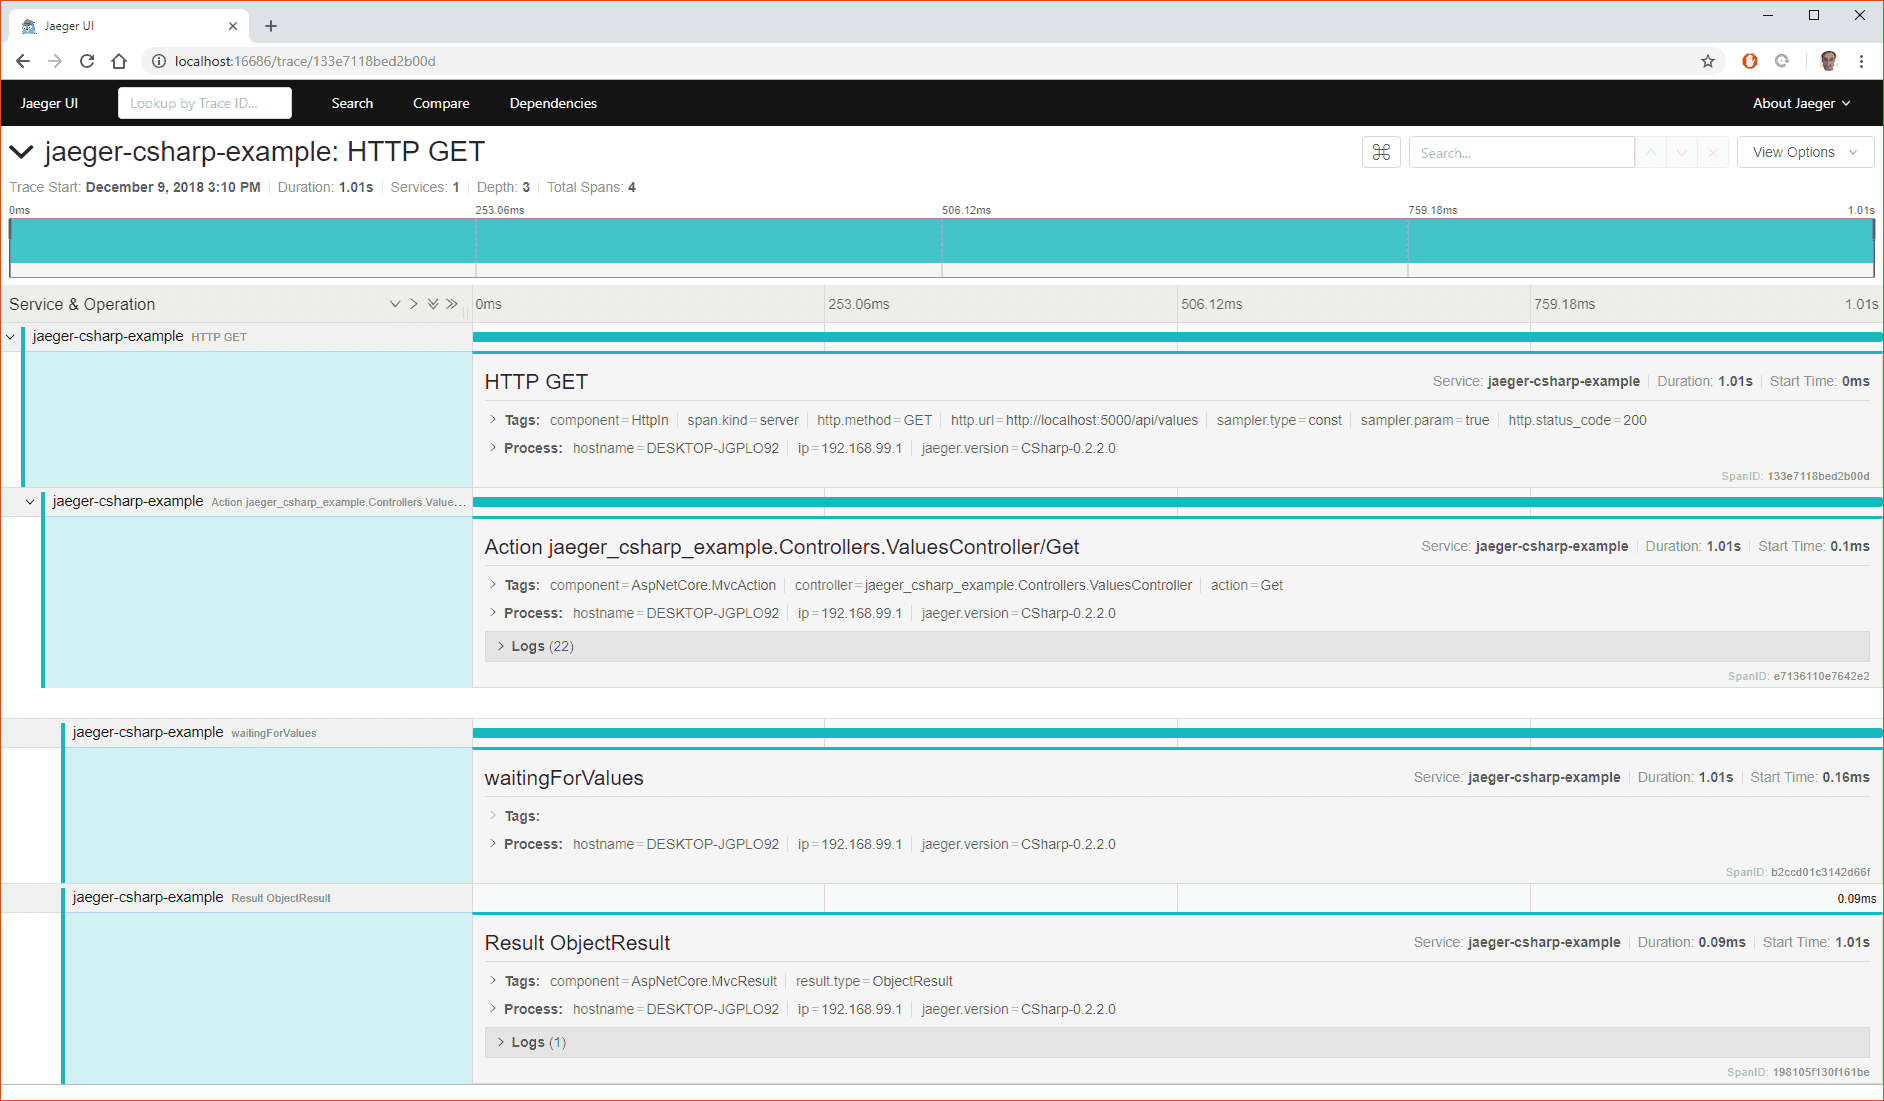
The HTTP GET call took 1.01 seconds on server side, and that Span “waitingForValues” spent 1s of that time.
Summary
The true power of OpenTracing and C# comes with distributed systems. When multiple APIs are talking to each other and using OpenTracing, debugging and performance tuning becomes more than guesses. Being able to see where time is being spent, hopefully not find unknown dependencies, and to know where failures happen is very valuable. Not to mention, OpenTracing is an open standard that’s vendor neutral.