
MSSQL Prometheus Exporter
Prometheus is an excellent way to store metrics. SQL Server is an excellent database. And I just happened to want to display custom metrics, so I wrote a custom Prometheus exporter for MSSQL.
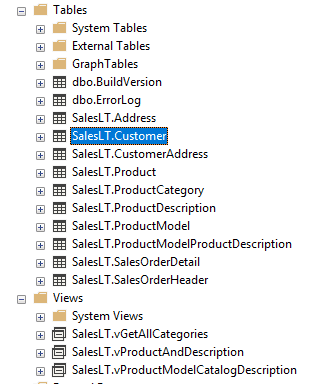
As my example, I just happen to have an Azure SQL database loaded up with AdventureWorksLT.
MSSQL Exporter
The custom MSSQL Exporter latest release is here.
Two metrics I care about here are the number of customers, and the the number of deadlocks: one application metric and one system metric.
I put this in “metrics.json”
{
    "Queries": [
        {
            "Name": "customers_count",
            "Query": "SELECT COUNT(*) CustomerCount FROM [SalesLT].[Customer]",
            "Description": "Counts the number of customers",
            "Columns": [
                {
                    "Name": "CustomerCount",
                    "Label": "customer_count",
                    "Usage": "Counter"
                }
            ]
        },
        {
            "Name": "mssql_deadlocks",
            "Query": "SELECT cntr_value FROM sys.dm_os_performance_counters where counter_name = 'Number of Deadlocks/sec' AND instance_name = '_Total'",
            "Description": "Number of lock requests per second that resulted in a deadlock since last restart",
            "Columns": [
                {
                    "Name": "cntr_value",
                    "Label": "mssql_deadlocks",
                    "Usage": "Gauge",
                    "DefaultValue": 0
                }
            ]
        }
    ],
    "MillisecondTimeout": 4000
}
And I put this environment variable in, for the exporter to pick up.
$env:PROMETHEUS_MSSQL_DataSource="Server=tcp:hjgjhg324.database.windows.net,1433;Initial Catalog=jjkhjk34;Persist Security Info=False;User ID={ USER ID };Password={ PASWORD }; MultipleActiveResultSets=False;Encrypt=True;TrustServerCertificate=False;Connection Timeout=30;"Then I can run mssql exporter.
> .\mssql_exporter.exe serve
Hosting environment: Development
Content root path: C:\Users\Daniel\Development\prometheus\mssql_exporter
Now listening on: http://[::]:80
Application started. Press Ctrl+C to shut down.
info: Microsoft.AspNetCore.Hosting.Internal.WebHost[1]
      Request starting HTTP/1.1 GET http://localhost:80/metrics
info: Microsoft.AspNetCore.Hosting.Internal.WebHost[2]
      Request finished in 1004.354ms 200 text/plain; version=0.0.4
Opening up http://localhost/metrics I see this. This is good enough for Prometheus to scrape.
# HELP customer_count customer_count
# TYPE customer_count COUNTER
customer_count 847
# HELP mssql_timeouts Number of queries timing out.
# TYPE mssql_timeouts GAUGE
mssql_timeouts 0
# HELP mssql_up mssql_up
# TYPE mssql_up GAUGE
mssql_up 1
# HELP mssql_exceptions Number of queries throwing exceptions.
# TYPE mssql_exceptions GAUGE
mssql_exceptions 0
# HELP mssql_deadlocks mssql_deadlocks
# TYPE mssql_deadlocks GAUGE
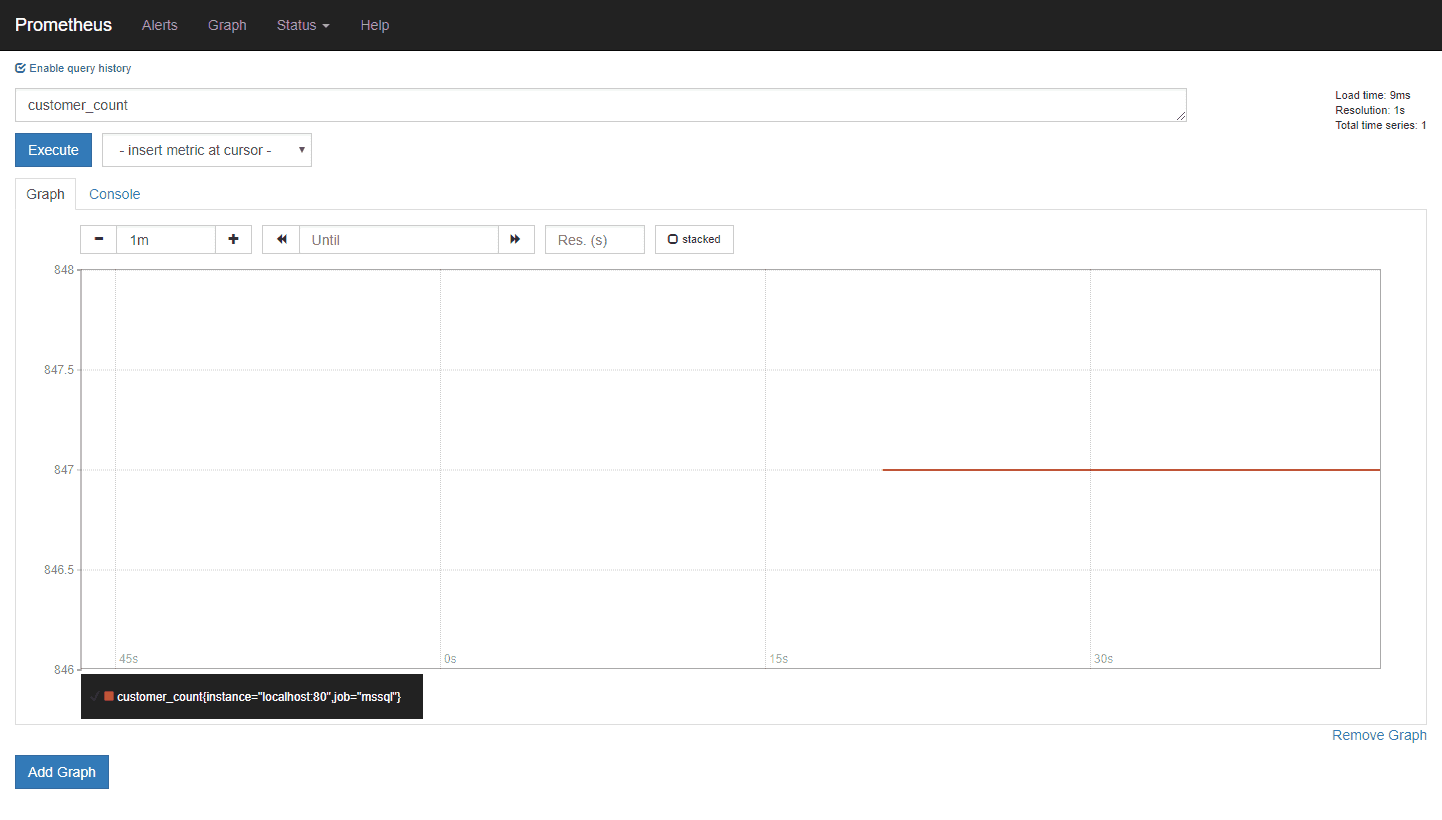
mssql_deadlocks 0Prometheus
The Prometheus configuration isn’t too far off from the default:
global:
  scrape_interval:     15s # Set the scrape interval to every 15 seconds. Default is every 1 minute.
  evaluation_interval: 15s # Evaluate rules every 15 seconds. The default is every 1 minute.

scrape_configs:
  - job_name: 'mssql'
    static_configs:
    - targets: ['localhost']
Grafana
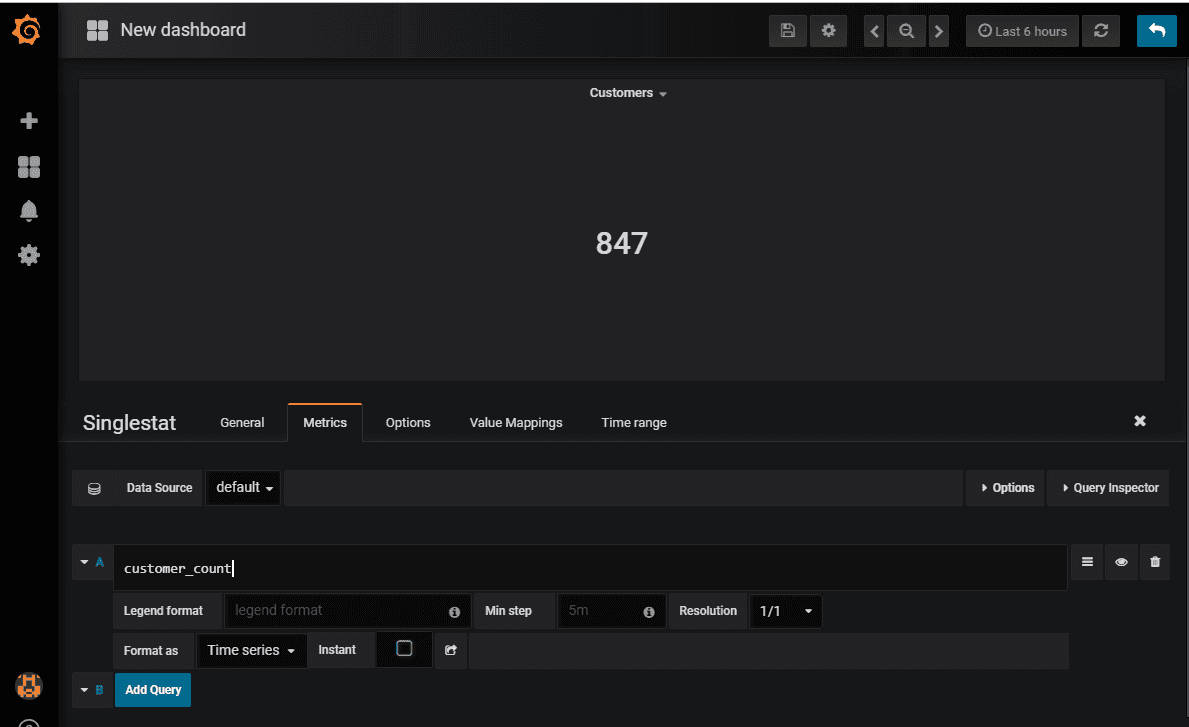
I’m not going to go over setting up Grafana because I list it out in this previous blog post. The main thing here, is that I can now add this custom metric to my Grafana dashboard.
Summary
If Prometheus can ingest data, then anything that consumes Prometheus, whether AlertManager or Grafana, can work with that data. Prometheus is a flexible method of ingesting data. Adding in custom application data from SQL Server means I can use Prometheus for custom business data in real-time.