
Grafana + Prometheus = Awesome
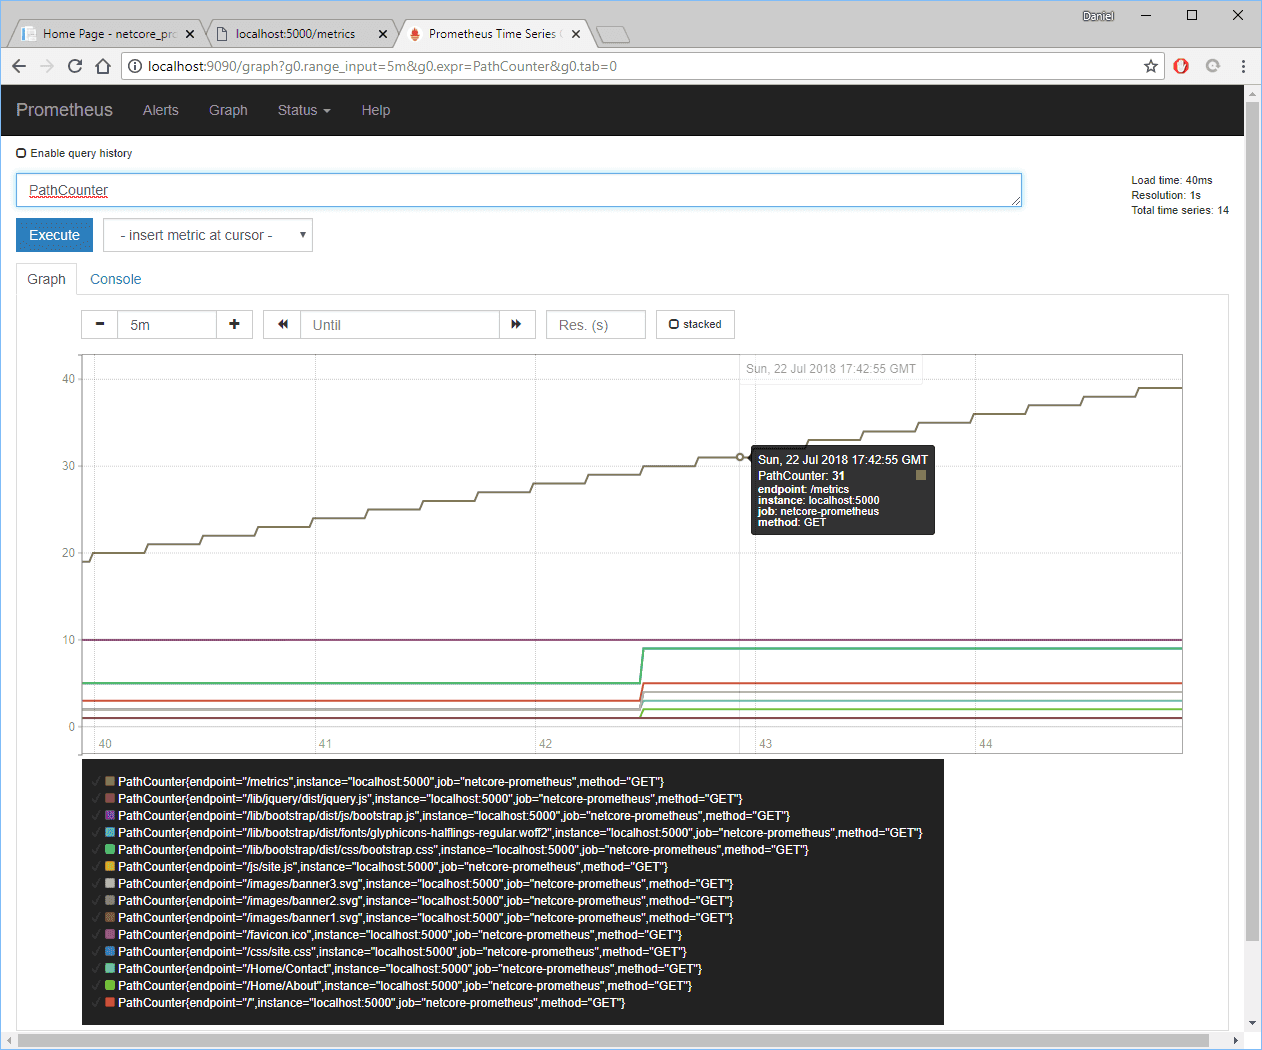
The first blog post for setting up Prometheus and adding a custom client library is here.
As a quick reminder, the custom metrics I have is the count of API calls by Method and Endpoint.
Grafana
Grafana is an excellent graphing data visualization platform. Go ahead and download it from here.
Start it with this command.
.\grafana-server.exe webPS C:\Users\Daniel\Downloads\grafana-5.2.1.windows-amd64\grafana-5.2.1\bin> .\grafana-server.exe web
...
...
...
[32mINFO[0m[07-24|19:04:18] Initializing SearchService [32mlogger[0m=server
[32mINFO[0m[07-24|19:04:18] Initializing PluginManager [32mlogger[0m=server
[32mINFO[0m[07-24|19:04:18] Starting plugin search [32mlogger[0m=plugins
[32mINFO[0m[07-24|19:04:18] Plugin dir created [32mlogger[0m=plugins [32mdir[0m=C:\\Users\\Daniel\\Downloads\\grafana-5.2.1.windows-amd64\\grafana-5.2.1\\data\\plugins
[32mINFO[0m[07-24|19:04:18] Initializing InternalMetricsService [32mlogger[0m=server
[32mINFO[0m[07-24|19:04:18] Initializing AlertingService [32mlogger[0m=server
[32mINFO[0m[07-24|19:04:18] Initializing HTTPServer [32mlogger[0m=server
[32mINFO[0m[07-24|19:04:18] Initializing CleanUpService [32mlogger[0m=server
[32mINFO[0m[07-24|19:04:18] Initializing NotificationService [32mlogger[0m=server
[32mINFO[0m[07-24|19:04:18] Initializing ProvisioningService [32mlogger[0m=server
[32mINFO[0m[07-24|19:04:18] Initializing RenderingService [32mlogger[0m=server
[32mINFO[0m[07-24|19:04:18] Initializing TracingService [32mlogger[0m=server
[32mINFO[0m[07-24|19:04:18] Initializing Stream Manager
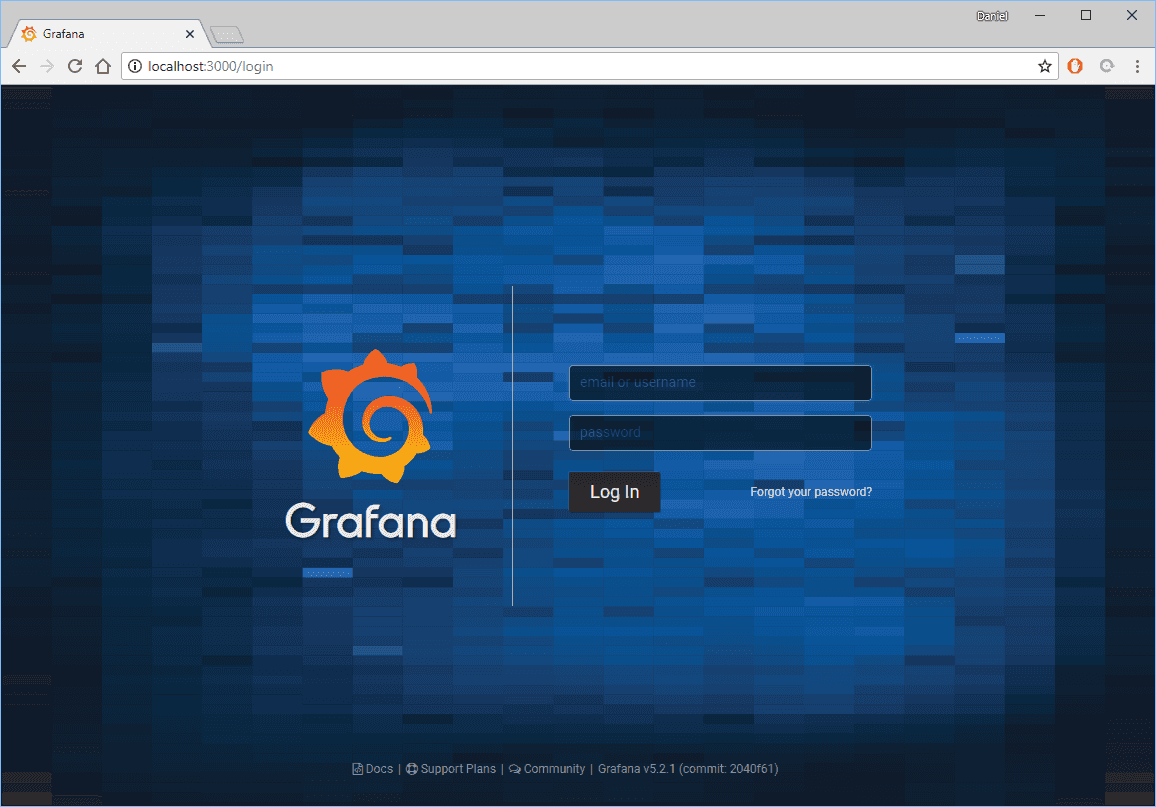
[32mINFO[0m[07-24|19:04:18] HTTP Server Listen [32mlogger[0m=http.server [32maddress[0m=0.0.0.0:3000 [32mprotocol[0m=http [32msubUrl[0m= [32msocket[0m=The default username and password is “admin” and “admin”. The url is http://localhost:3000/login. On first login, you might be prompted to change password.
On first login, there won’t be anything to show.
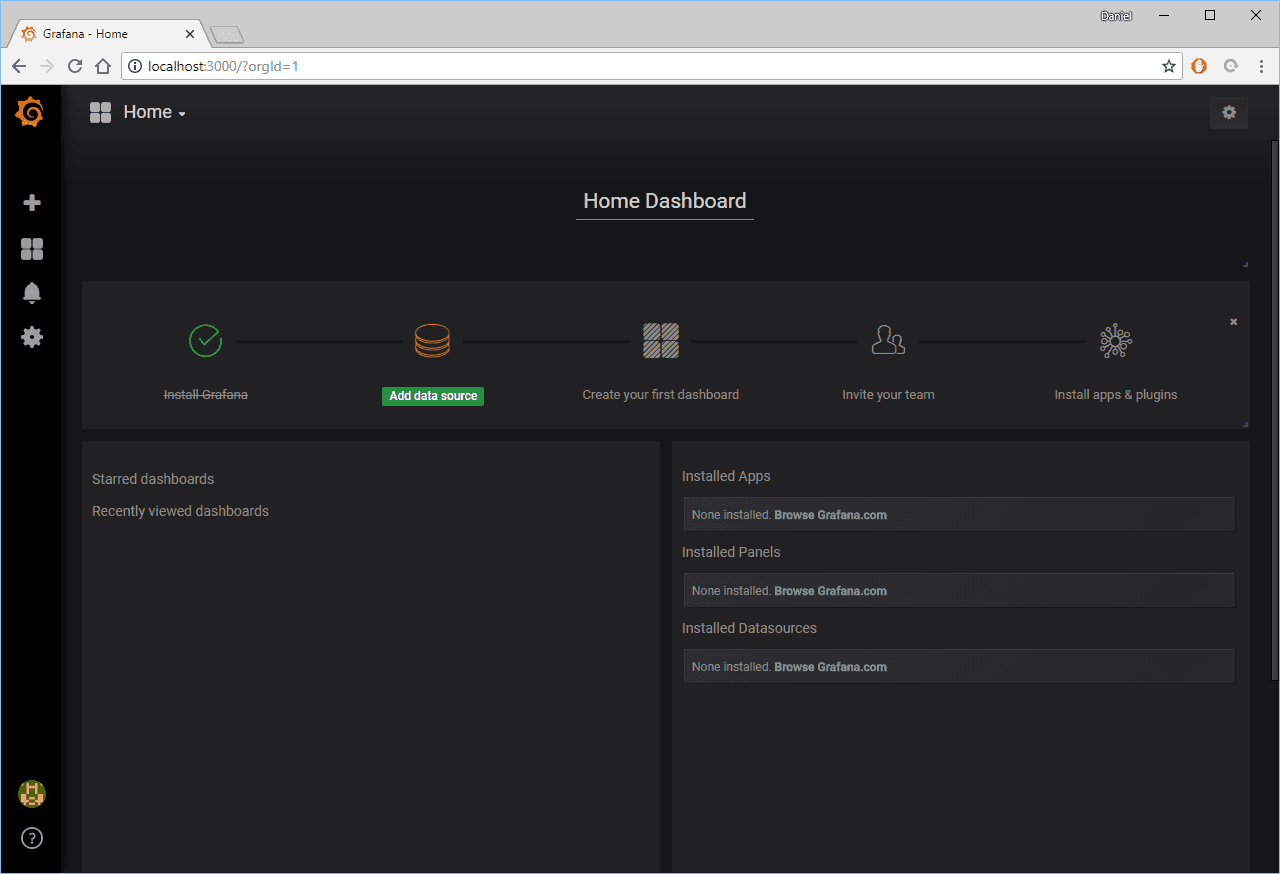
Go ahead and click on that “Add data source”. But make sure that Prometheus is running on the local machine.
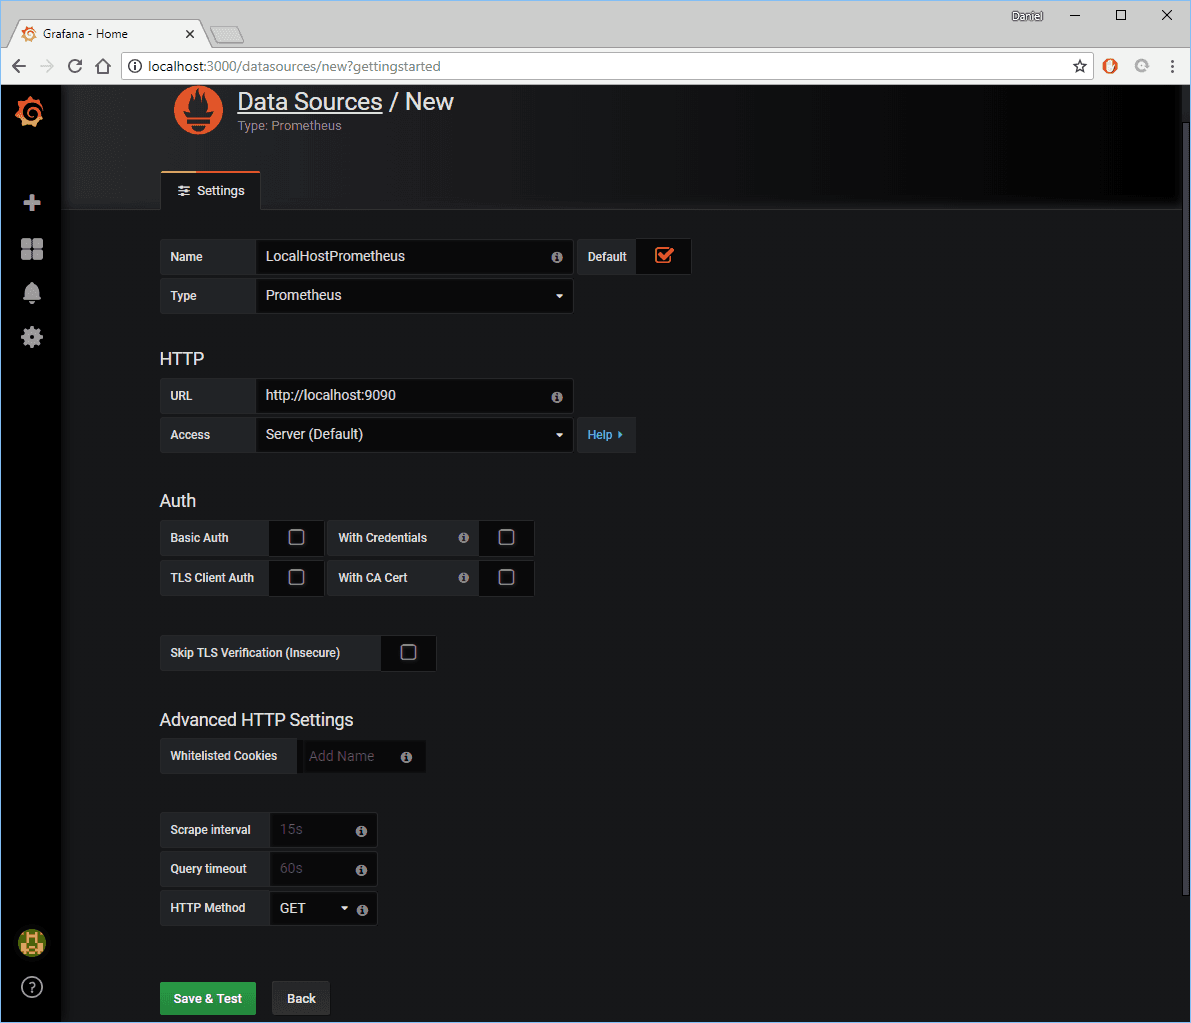
Fill out Grafana Data source as shown below to add a localhost Prometheus, then “Save &d Test”.
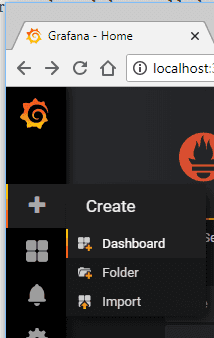
Choose “New Dashboard” from the side button.
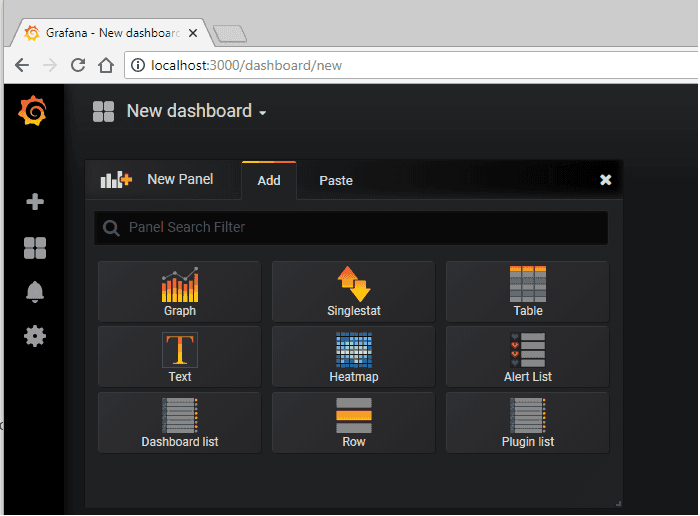
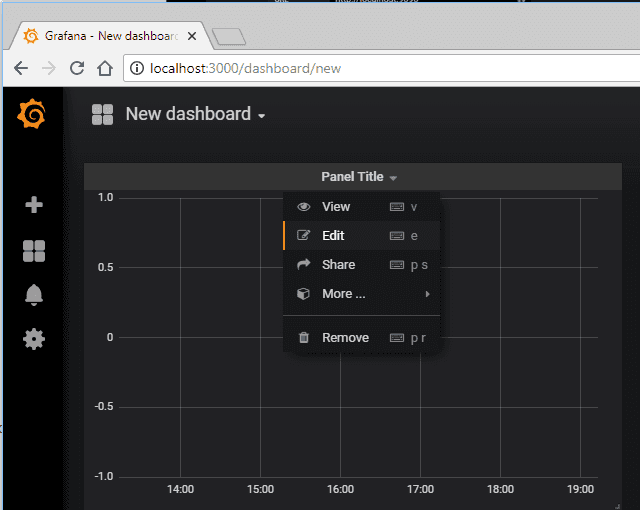
Let’s create a new graph panel.
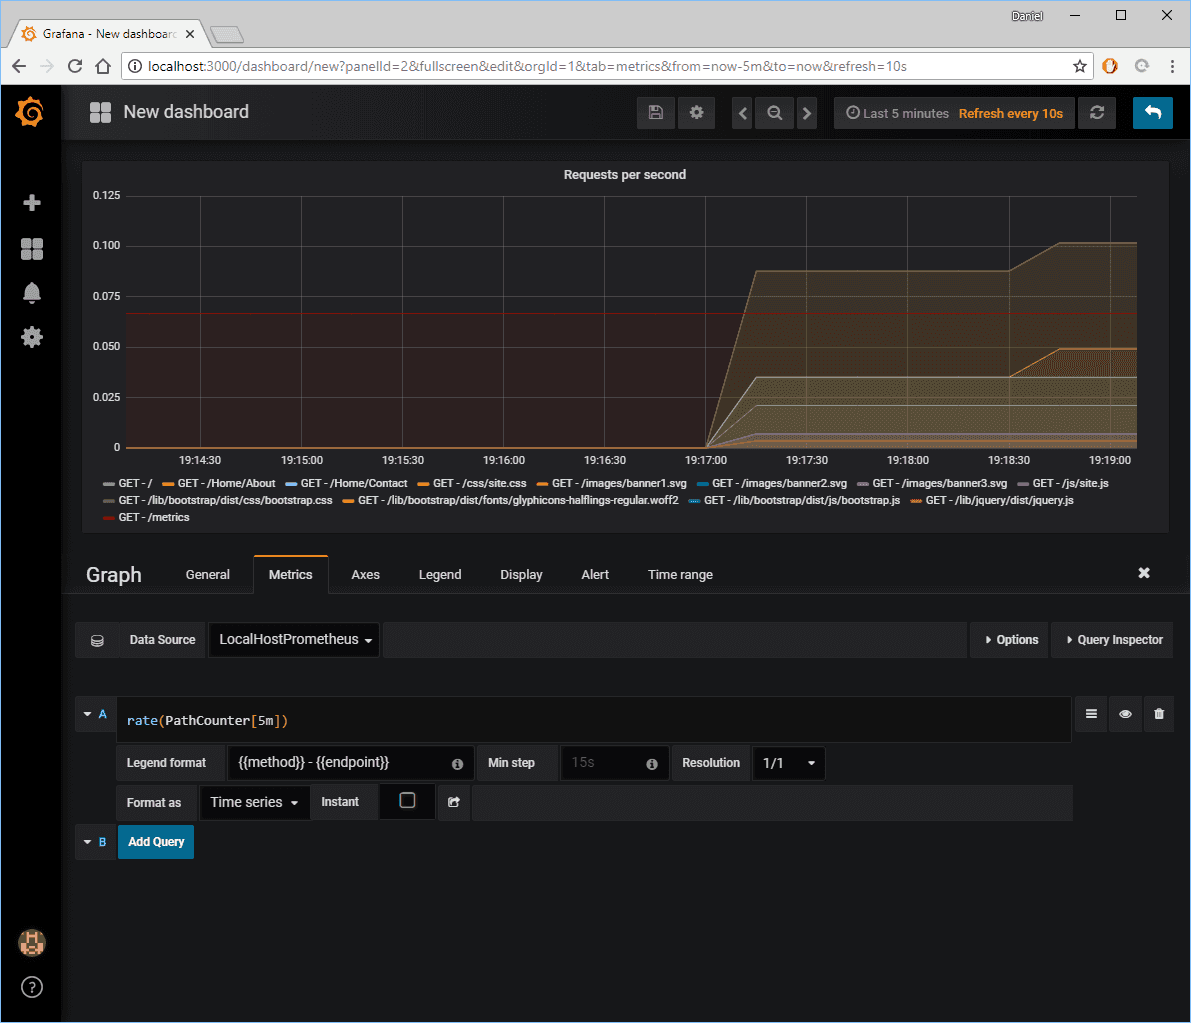
Fill out the textboxes with below. Also, make sure to do whatever needed to generate custom metrics.
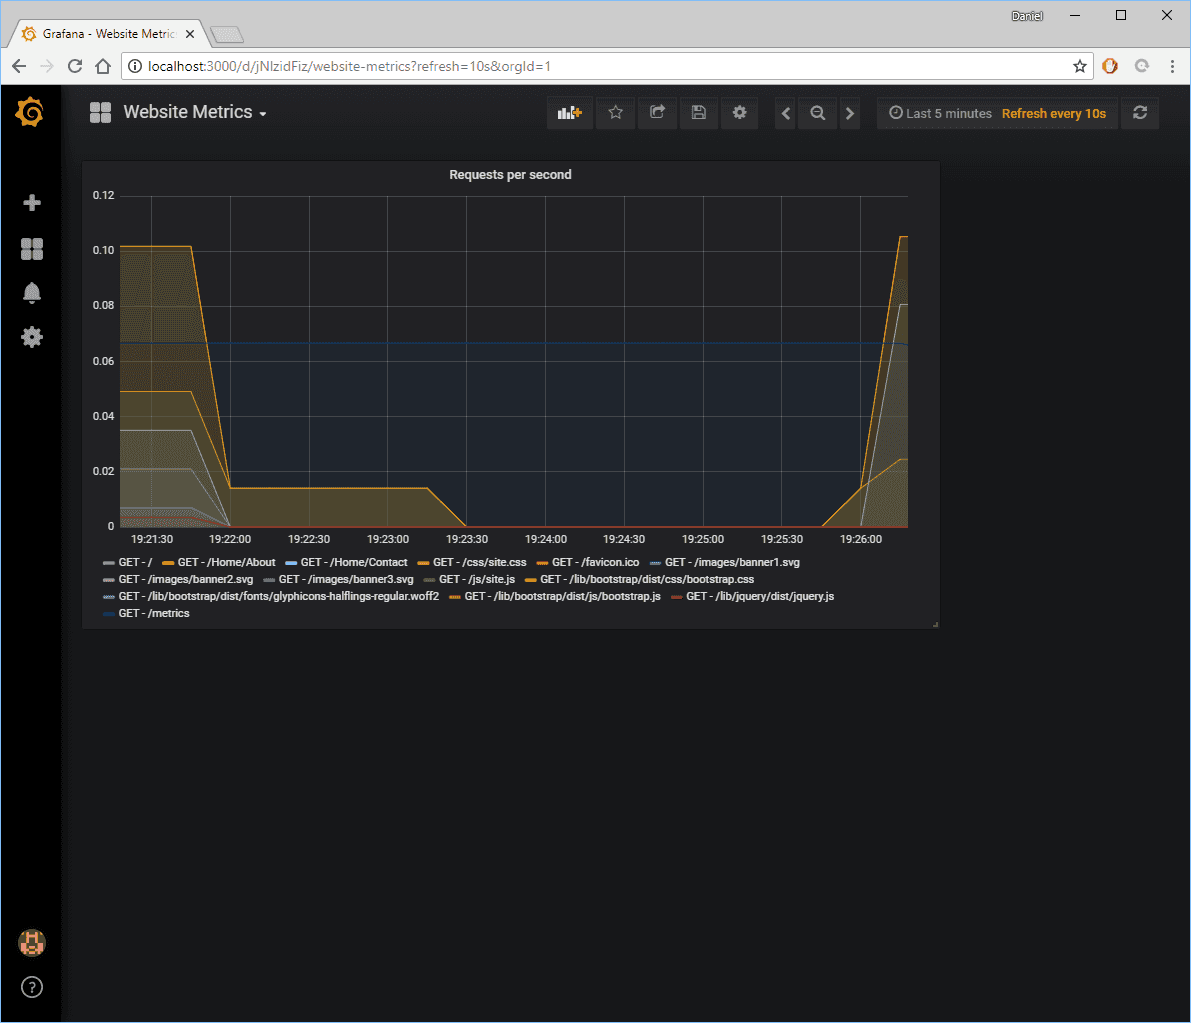
- Formula: rate(PathCounter[5m])
- Legend Format: {{method}} - {{endpoint}}
On the top, there’s a “Save button” icon. Click
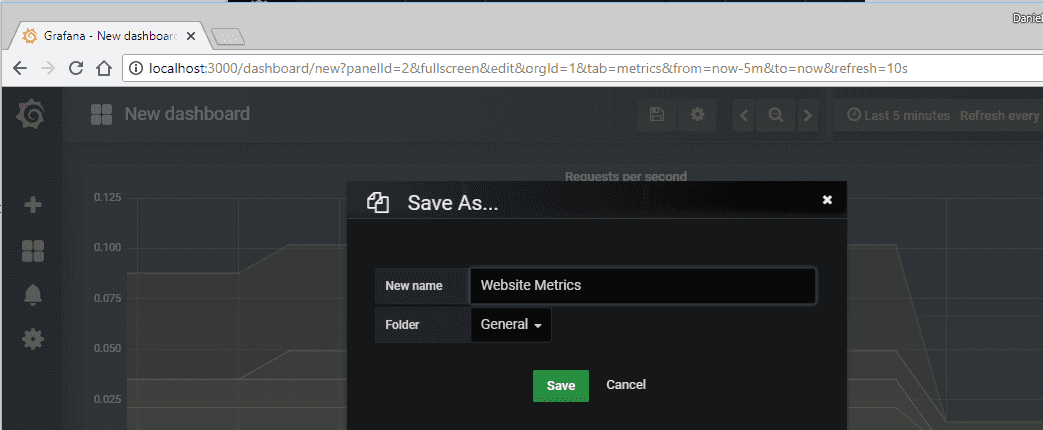
Congratulations! The dashboard now has a fancy graph showing data in real-time.
Summary
Add dashboards, add panels, add visualizations. Customize the view of data however you need to. Make the data actionable and valuable for your boss, for your team, and for you. Data visualization without meaning is just white noise.